Recently I came across Sam Wilson’s Python heatmap map of Strava runs, and wanted to see if I could get a similar result using R Markdown. Check out the original for a great write-up of the ins and outs and mapping frequency of visits, pace and gradient at Sam’s GitHub repo https://github.com/moresamwilson/running-heatmap.
Instead of using the Strava API (like I did in April for the 2026 chart challenge), Sam uses a download of Strava activities which makes the whole process a lot faster. I’ve adopted the same approach, with some help from Claude.ai.
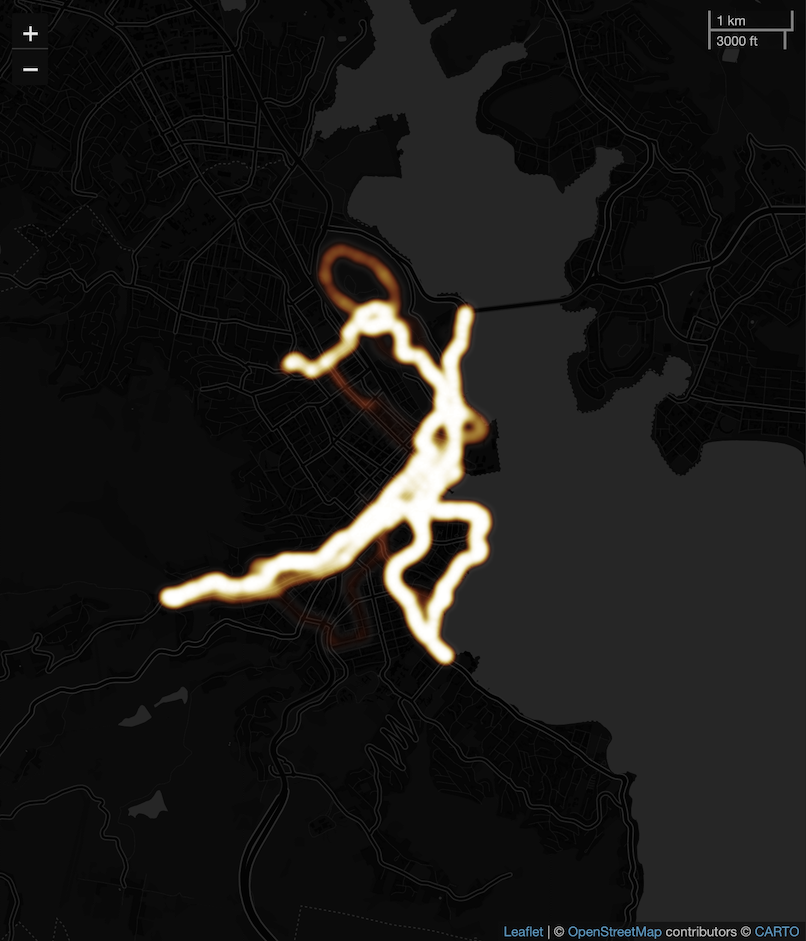
My version keeps just the frequency. The hard work of producing the “heatmap” is via Leaflet (which I’ve blogged about before) and leaflet.extras::addHeatmap - basically, the more times a GPS point appears in the Strava activities, the brighter it’s displayed on the map.
Here’s the heatmap generated from my runs around beautiful Hobart, Tasmania…looking (unintentionally) a little like a drawing of a falling runner:
The R Markdown file, so you can generate your own heatmap, can be found at https://github.com/thomasswilliams/r-strava-heatmap-2026.
To use the R Markdown file
You’ll need:
If you don’t want to install R and RStudio, an alternative is to run the code in Docker. I go through the necessary steps for another R Markdown file at https://github.com/thomasswilliams/r-markdown-docker-test.
- R and RStudio
- packages
shiny,flexdashboard,leaflet,leaflet.extrasand others (see the strava_heatmap.Rmd R Markdown file in my GitHub repo at https://github.com/thomasswilliams/r-strava-heatmap-2026/blob/main/strava_heatmap.Rmd) - a download of your Strava data; Strava calls this “bulk export” and documents it at https://support.strava.com/hc/en-us/articles/216918437-Exporting-your-Data-and-Bulk-Export#h_01KGG64N4RTPX2SC9VV9JJZR3R
- unzip the download into a directory called strava_export in the same directory as strava_heatmap.Rmd - the directory structure will look like:
┣ 📂 strava_export
┃ ┣ 📂 activities
┃ ┃ ┣ (.gpx, .fit, .gpx.gz files)
┃ ┃ ┗ ...
┃ ┗ activities.csv
┗ strava_heatmap.Rmd
You only need the activities directory and activities.csv from the Strava download.
With all this in place, run the R Markdown file in RStudio, and click the “Load data” button.
To get the best results, center the Leaflet map using latitude and longitude, and set an appropriate zoom level - controlled in strava_heatmap.Rmd at the top of the file on lines 55-59:
# map centre — Hobart, Tasmania defaults for me!
DEFAULT_LAT <- -42.8821
DEFAULT_LON <- 147.3272
# initial zoom level of Leaflet map
DEFAULT_ZOOM <- 13L
Other options at the top of the file include: ACTIVITY_TYPES, which controls the type of Strava activities included (though only those with GPS points display on the map); and DEBUG helps with understanding why certain files don’t load.