R is a powerful “…free software environment for statistical computing and graphics”. It’s widely used in a variety of fields, and can even run in SQL Server.
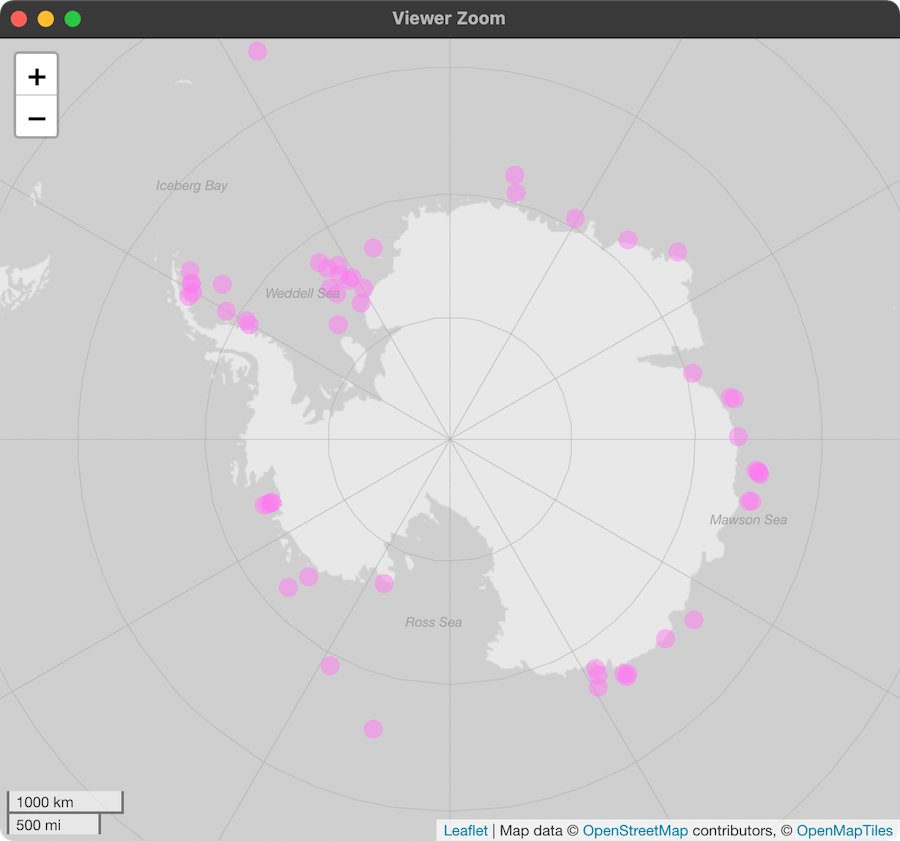
I’m an R noob, even so with a little help I was able to put together a quick demo using Leaflet for R to replicate as much functionality as possible from my web-based Antarctic map at https://thomasswilliams.github.io/leaflet-antarctic-demo/.
If you’re following along, before you start you’ll need R from https://www.r-project.org/ and the free RStudio Desktop from https://www.rstudio.com/products/rstudio/.
The first run of the code below will install & reference required packages. The code depends on two TopoJSON files which I’ve put in a new repo at https://github.com/thomasswilliams/leaflet-antarctica-demo-for-r.
What does the R code do?
The R code is in a single “demo” file. Much of it is adapted from my web-based map. In a nutshell, the code:
- installs and references dependencies like Leaflet, rgdal (used for Antarctic projection), “mustashe” caching (lines 1-27)
- loads local TopoJSON files, and caches; downloads GeoJSON from my GitHub Pages-hosted map, and caches (lines 29-59)
- sets up the EPSG:3031 Antarctic projection (lines 61-88)
- creates a map and layers from the loaded files, styles layers (lines 90-180)
- displays the map using the in-built R viewer (lines 182-197)
What’s different to the browser-based Leaflet map?
The following is missing from the R version:
- caching of tiles (though as discussed, I cache everything else)
- custom SVG icons (though can load icons from file)
- async loading of GeoJSON (caching helps with this - after the first run, the R code is a lot faster)
- dependencies not referenced from a CDN, downloaded to computer
- tile colors using CSS (I just couldn’t figure this out)
- loading shapefiles - though this is definitely owing to my lack of knowledge, I persisted and eventually got shapefiles to GeoJSON to TopoJSON displaying
Also, you need R to run it (versus only a web browser to view the original), and the version of Leaflet is older (1.3) compared to 1.8 in the web version.
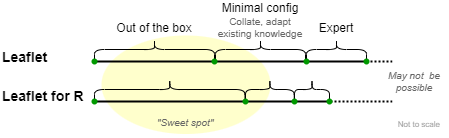
However, I see a ton of advantages using R. It let me be productive, quicker, with less expertise needed. I like to think of this as the “sweet spot” where a lot can be achieved (the 80% as per the 80/20 rule), to get a better idea if more effort should be applied to address the remaining 20%:
Since I’m on a list binge, some of the advantages I noticed of the R version were:
- first-class debugging using RStudio
- lots of good examples and documentation for Leaflet, rgdal online
- some required dependencies, such as Proj4, already included
- code is simpler, complexity is hidden (for instance, referencing dependencies, no need to write javascript)
- Leaflet popup tooltips and labels easier to use, built-in
- less than 200 lines of code to get a passable Leaflet Antarctic map in R, the outcome looks very similar to my web-based version which has 300 lines of code
- under the hood, R generates the same javascript, so javascript skills are transplantable
- R is super powerful and can do much more than display a map - could combine with any dataset, analyse data, plot, create a dashboard, etc.
The code is below, can also be found at the GitHub repo at https://github.com/thomasswilliams/leaflet-antarctica-demo-for-r:
# install "pacman" package
# will load and install subsequent packages if necessary
if (!require("pacman")) install.packages("pacman")
# ********************* load packages *********************
# load (plus background install if not present) package, requires "pacman"
# Leaflet for R
# https://rstudio.github.io/leaflet/
pacman::p_load(leaflet)
# Bindings for the 'Geospatial' Data Abstraction Library
# https://cran.r-project.org/web/packages/rgdal/index.html
pacman::p_load(rgdal)
# Leaflet extensions
# https://github.com/r-spatial/leafem
pacman::p_load(leafem)
# htmlwidgets for R
# https://www.htmlwidgets.org/
pacman::p_load(htmlwidgets)
# Tools for creating, manipulating, and writing HTML from R
# https://rstudio.github.io/htmltools/index.html
pacman::p_load(htmltools)
# Simple and Robust JSON Parser and Generator for R
# https://cran.r-project.org/web/packages/jsonlite
pacman::p_load(jsonlite)
# mustashe caching
# https://jhrcook.github.io/mustashe/
pacman::p_load(mustashe)
# create a cache key of today's date in YYYY-MM-DD format
cache_key <- Sys.Date()
# for all loaded data, cache for one day using mustashe
# this means subsequent runs on the same day will be faster as
# data is retrieved from cache after the first run
# assumes data does not change very often
mustashe::stash("longitude", depends_on = "cache_key", {
# load local 30 degree longitude lines originally from Quantarctica
# converted to GeoJSON then TopoJSON using https://rowanwins.github.io/geojson-editor/
# if doesn't work, may need to set this directory as working directory
# load as string as per TopoJSON example at https://rstudio.github.io/leaflet/json.html
longitude <- readLines("30dg_longitude.topojson", warn = FALSE) %>%
paste(collapse = "\n") %>%
jsonlite::fromJSON(simplifyVector = FALSE)
})
mustashe::stash("latitude", depends_on = "cache_key", {
# local latitude graticules from Quantarctica
latitude <- readLines("10dg_latitude.topojson", warn = FALSE) %>%
paste(collapse = "\n") %>%
jsonlite::fromJSON(simplifyVector = FALSE)
})
mustashe::stash("icebergs", depends_on = "cache_key", {
# load icebergs GeoJSON from my Github Pages
icebergs <- rgdal::readOGR("https://thomasswilliams.github.io/leaflet-antarctic-demo/icebergs-apr-2022.json")
})
mustashe::stash("feature_names", depends_on = "cache_key", {
# load feature names GeoJSON from my GitHub Pages
feature_names <- rgdal::readOGR("https://thomasswilliams.github.io/leaflet-antarctic-demo/geonames-selected-feature-names.json")
})
# map extent
extent <- 12367396.2185
# hard-code resolutions array
# need to match Leaflet zoom levels (resolutions) to whatever site is used for tiles (in this case, GBIF)
resolutions <- c(
48310.14147851562, 24155.07073925781, 12077.535369628906, 6038.767684814453, 3019.3838424072264, 1509.6919212036132,
754.8459606018066
)
# create CRS definition for EPSG:3031
# Proj4Leaflet integrated into Leaflet for R package
# custom bounds as defined by tiles site used (GBIF)
# see https://tile.gbif.org/ui/3031/EPSG3031-leaflet.js
epsg_3031 <- leaflet::leafletCRS(
crsClass = "L.Proj.CRS",
# name
code = "EPSG:3031",
# proj4 definition of CRS
# see https://spatialreference.org/ref/epsg/3031/, https://epsg.io/3031
proj4def = "+proj=stere +lat_0=-90 +lat_ts=-71 +lon_0=0 +k=1 +x_0=0 +y_0=0 +datum=WGS84 +units=m +no_defs",
# zoom resolutions
resolutions = resolutions,
# top-left corner of map
origin = c(-extent, extent),
# bounds, adapted from https://github.com/cran/robis/blob/master/R/map.R
bounds = list(c(-extent, -extent), c(extent, extent))
)
# Leaflet map options
map_options <- leaflet::leafletOptions(
# set center (South Pole) and zoom level
center = c(-90, 0),
zoom = 2,
# minimum & maximum zoom
minZoom = 1,
maxZoom = 6,
# CRS
crs = epsg_3031,
# disable jumping to a copy of the map (plays up on mobile)
worldCopyJump = FALSE,
# prefer canvas (over SVG) renderer
preferCanvas = TRUE
)
# create the map and add layers
map = leaflet::leaflet(options = map_options) %>%
# base map tiles (from https://tile.gbif.org/ui/)
# use light style, SRS 3031
leaflet::addTiles(
urlTemplate = "https://tile.gbif.org/3031/omt/{z}/{x}/{y}@1x.png?style=gbif-light",
attribution = 'Map data © <a href="https://www.openstreetmap.org/copyright" rel="noopener noreferrer">OpenStreetMap</a> contributors, © <a href="https://www.openmaptiles.org/copyright" rel="noopener noreferrer">OpenMapTiles</a>',
# from https://github.com/cran/robis/blob/master/R/map.R
options = tileOptions(
tileSize = 512,
noWrap = TRUE,
continuousWorld = TRUE,
# update map after finish of zoom/pan
updateWhenZooming = FALSE,
updateWhenIdle = TRUE
)
) %>%
# add longitude lines
# could not get working with GeoJSON, works with TopoJSON
leaflet::addTopoJSON(
topojson = longitude,
# light lines
weight = 0.8,
color = "#acacad",
opacity = 0.5,
# no fill
fillOpacity = 0,
fill = FALSE
) %>%
# add latitude lines
leaflet::addTopoJSON(
topojson = latitude,
# light lines
weight = 0.8,
color = "#acacad",
opacity = 0.5,
# no fill
fillOpacity = 0,
fill = FALSE
) %>%
# iceberg positions from GeoJSON
leaflet::addCircleMarkers(
data = icebergs,
radius = 7,
# purple circle
fillColor = "#ee82ee",
fillOpacity = 0.5,
# no outer line
stroke = FALSE,
# add popup from "name" property from GeoJSON
popup = ~sprintf("<strong>%s</strong>", name),
popupOptions = popupOptions(closeButton = FALSE)
) %>%
# add feature name labels (text)
leafem::addStaticLabels(
feature_names,
# text will be "name" property
label = feature_names$name,
style = list(
"color" = "#99999a",
"font-style" = "italic"
)
) %>%
# configure additional niceties directly on Leaflet map object in javascript
# in this case, scale control
# as per https://rstudio.github.io/leaflet/morefeatures.html#custom-javascript-with-htmlwidgetonrender
htmlwidgets::onRender(jsCode = "
function(el, x) {
var map = this;
// create scale control, see https://www.tutorialspoint.com/leafletjs/leafletjs_controls.htm
var scale = L.control.scale();
// add scale control to map
// by default, bottom-left corner
scale.addTo(map);
}")
# add custom CSS to RStudio Viewer HTML
# adapted from https://stackoverflow.com/a/35775262
htmltools::browsable(
htmltools::tagList(list(
# add to head tag
htmltools::tags$head(
# create style tag and inject basic styles to somewhat match https://thomasswilliams.github.io/leaflet-antarctic-demo/
# will need lots of "!important" to override inline styles
# could not get tile styles (filter) to work
# map element is called "leaflet"
htmltools::tags$style("body { margin: 0 !important; padding: 0 !important; } html, body, .leaflet { height: 100% !important; width: 100vw !important; } .leaflet-tile-pane .leaflet-layer { filter: sepia(30%) hue-rotate(160deg) contrast(120%) !important; }")
),
# render with Leaflet map
map
))
)