In the first part of this series, I created an interactive web-based map displaying Antarctica, using the awesome Leaflet javascript library. The end result was a single HTML file - map tiles from Global Biodiversity Information Facility (GBIF), open-source CSS and javascript references from the unpkg CDN - served with GitHub pages, available at https://thomasswilliams.github.io/leaflet-antarctic-demo/.
I’m working towards loading layers from shapefiles, but before I do, need to take a detour to GeoJSON.
GeoJSON is (from the 2016 IETF spec at https://datatracker.ietf.org/doc/html/rfc7946, via https://geojson.org/):
GeoJSON is a geospatial data interchange format based on JavaScript Object Notation (JSON). It defines several types of JSON objects and the manner in which they are combined to represent data about geographic features, their properties, and their spatial extents. GeoJSON uses a geographic coordinate reference system, World Geodetic System 1984, and units of decimal degrees.
To incorporate loading and displaying GeoJSON data into the existing Leaflet Antarctica demo repo, I first manually put together icebergs-apr-2022.json based on the web page “Current Antarctic large iceberg positions derived from ASCAT and OSCAT-2”, retrieved from https://www.scp.byu.edu/current_icebergs.html. The file has a collection of “features” (points), each with a coordinate (longitude, then latitude) and optional properties which I’ve used for the iceberg name. The first few lines of the file look similar to:
{
  "type": "FeatureCollection",
  "features": [
    {
      "type": "Feature",
      "geometry": {
        "type": "Point",
        "coordinates": [-30, -70]
      },
      "properties": {
        "name": "Iceberg name"
      }
    },
    ...
Leaflet has an example of creating a GeoJSON layer at https://leafletjs.com/examples/geojson/. I built on this in my existing index.html to load the file, then add a layer with each point as a custom SVG icon, and each point with a popup tooltip. The code I’ve added is:
// ************************************************************************
// "Current Antarctic large iceberg positions derived from ASCAT and OSCAT-2"
// retrieved from https://www.scp.byu.edu/current_icebergs.html May 2022 (looks to be last updated late April 2022)
// load positions from GeoJSON file
// ************************************************************************

// function to load a GeoJSON file
async function loadGeoJSON() {
  // get the iceberg location JSON file from this repo
  // content adapted from list at https://www.scp.byu.edu/current_icebergs.html
  const response = await fetch('./icebergs-apr-2022.json');
  // convert response (string) to JSON object
  const json = await response.json();
  // return the JSON object
  return json;
}

// function to create an SVG icon for icebergs
// adapted from https://onestepcode.com/leaflet-markers-svg-icons/
// create a triangle polygon using SVG
const IcebergIcon = L.divIcon({
  html: `<svg width="10" height="10" version="1.1" xmlns="http://www.w3.org/2000/svg">
    <polygon points="10,0 10,10 0,5" fill="#ee82ee"/>
  </svg>`,
  className: 'iceberg-icon',
  // 10 by 10 icon
  iconSize: [10, 10],
  // icon anchor in center
  iconAnchor: [5, 5]
});

// function called once for each created feature in a layer
// add popup from "name" properties from GeoJSON
// adapted from https://javascript.tutorialink.com/dynamically-loading-multiple-external-geojson-data-files-and-calling-multiple-layers-dynamically-using-leaflet/
// Leaflet "onEachFeature" function
const addPopupFromFeatureProperties = (feature, layer) => {
  // create popup text from "name" property
  // start with initially empty popup
  let popupContent = '';
  if (feature.properties && feature.properties.name) {
    popupContent = '<strong>' + feature.properties.name + '</strong>';
  }
  // if we have popup text, add it
  if (popupContent && popupContent !== '') {
    layer.bindPopup(popupContent);
  }
};

// style points as iceberg icons
// Leaflet "pointToLayer" function
const IcebergPoint = (geoJsonPoint, latlng) => {
  return L.marker(latlng, { icon: IcebergIcon });
};

// add GeoJSON layer: load file, then display individual points as set icon
// first, load the passed JSON file
loadGeoJSON().then(data => {
  // create new Leaflet layer from JSON object
  // call our own functions for the style of marker, and popup
  L.geoJSON([data], { pointToLayer: IcebergPoint, onEachFeature: addPopupFromFeatureProperties }).addTo(map);
});
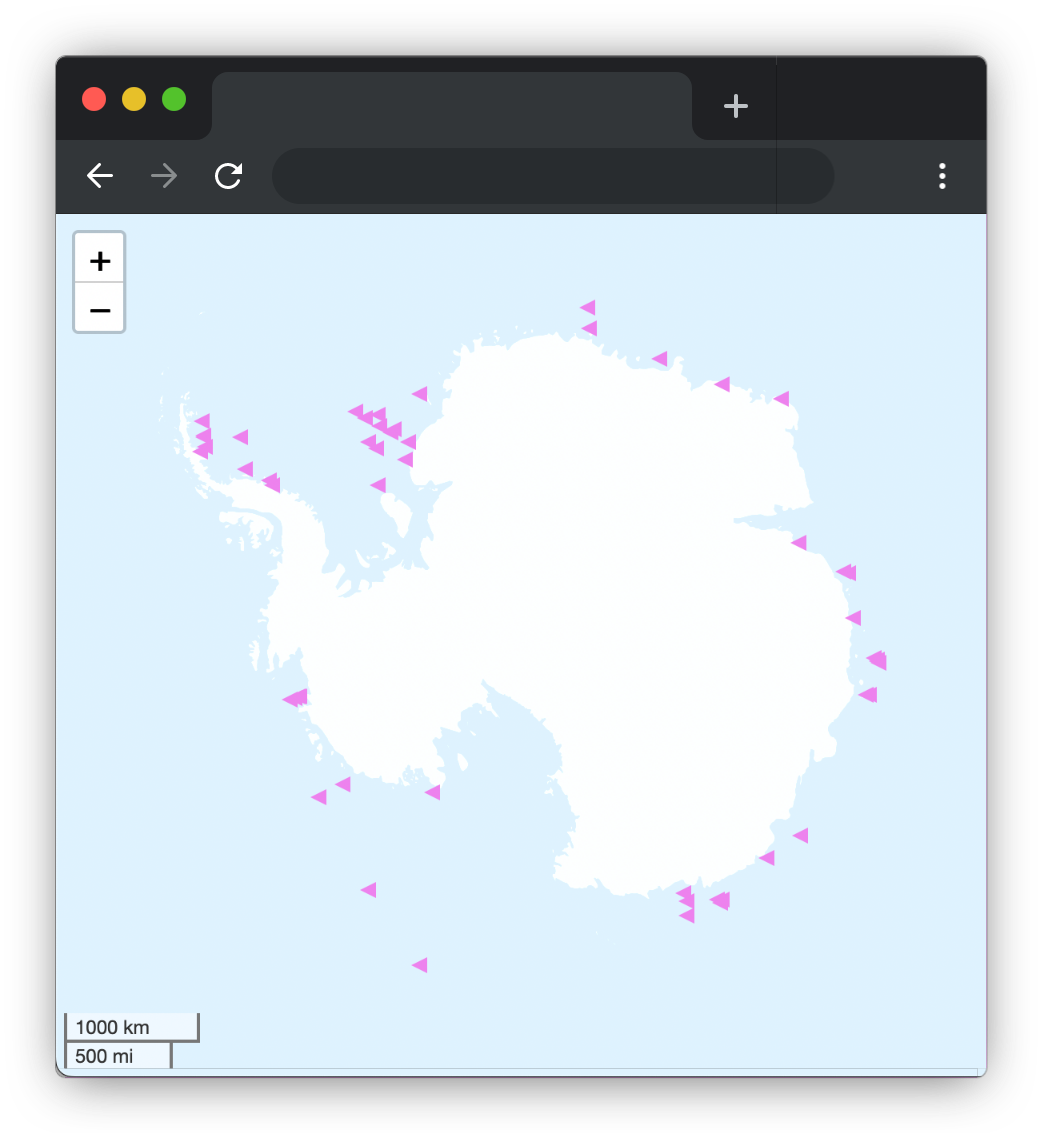
The map now looks like (with purple triangles for icebergs):
In part 2, I’ll import a couple of shapefiles to make a more interesting map of Antarctica.