In this post I’m going to use the brand-new version 1.8 of Leaflet, the “…leading open-source JavaScript library for mobile-friendly interactive maps…” (with more than 33K stars on GitHub), to create an interactive web-based viewer for an Antarctic map. I’ll create a single web page, reference dependencies, choose a suitable projection, and implement basic features with Leaflet. In a future part 2, I’ll show how to import shapefiles from some interesting sources, which highlights Leaflet’s versatility.
Disclaimer: I’m not a GIS expert or professional web developer; I’m a guy that solves problems. Everything mentioned in this post was correct at time of writing, using Leaflet version 1.8. Test any code you find on this site, as I don’t take any responsibility, nor provide support, for code on this blog.
If you open Google Maps (or similar) and pan all the way down to Antarctica, you’ll most likely see a massive horizontal continent that looks like it could fit most of the rest of the world in it. This is a side-effect of maps using a Mercator (or similar) projection. Mercator projections are one of thousands of projections, all suited to different specific ways to represent parts of a bumpy mostly-sphere (Earth) on a flat map.
The WGS84 Antarctic Polar Stereographic projection, EPSG:3031 is better suited to showing Antarctica relatively distortion-free. Unavoidably, distortion does occur, increasing the further from the South Pole you go, and the projection only goes to the equator. There’s alternative projections/reference systems that could potentially be used; I settled on EPSG:3031 for simplicity and broad cross-compatibility - for instance, the Scientific Committee on Antarctic Research (SCAR) provides resources in that projection, see https://www.scar.org/resources/antarctic-digital-database/.
For more background on polar projections in Leaflet, check out https://wiki.openstreetmap.org/wiki/Antarctica/Creating_a_map and a ton of reference information at https://nsidc.org/data/polar-stereo/ps_grids.html (also references at the end of this post).
Back to the map: the first step is to create the web page index.html. To develop & test, index.html needs to be “served” as a web page. I installed Node and package http-server globally, then ran http-server -o from the directory that contains index.html. This serves the page and opens it in a browser.
Rather than go over the HTML, CSS and javascript step-by-step, I’m going to jump straight to a basic index.html file I prepared earlier, which can be found in my “leaflet-antarctic-demo” repository at https://github.com/thomasswilliams/leaflet-antarctic-demo. If you copy the index.html file from the repo, save it to a local directory, and from a command prompt in the directory run http-server -o, your browser should open to localhost:8080 and the page will be displayed like below. This is a very basic Leaflet map:
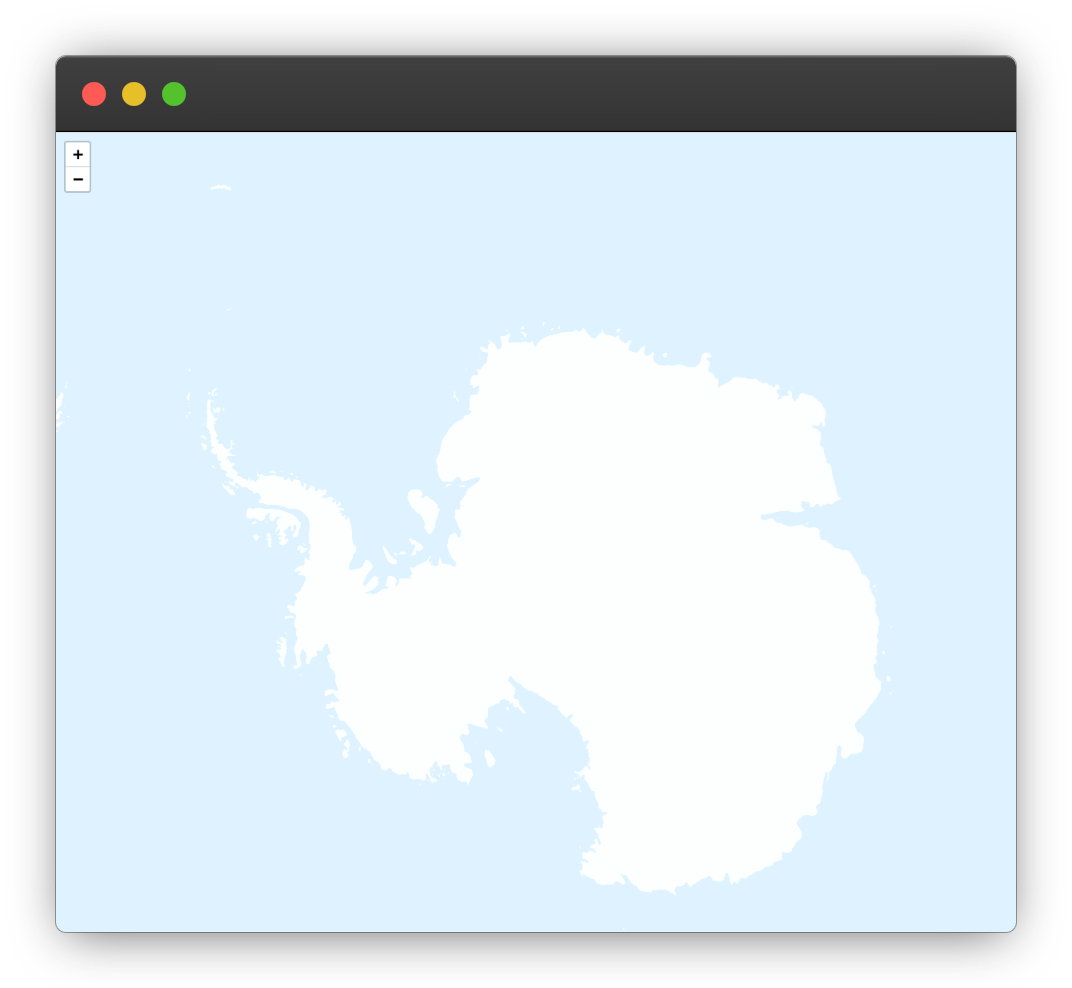
(If you’re having trouble at this point, check the Leaflet tutorials which go over the basics of Leaflet functionality.)
Thanks to Leaflet and the other open-source resources that are referenced, in around 150 lines of code (including numerous comments) we’ve made a basic Antarctic-centric interactive map:
- referenced Leaflet javascript and CSS files from a CDN
- referenced a couple of open-source scripts from https://kartena.github.io/Proj4Leaflet/ (again, from a CDN) to use the EPSG:3031 projection discussed above
- referenced open-source OpenStreetMap/OpenMapTiles tiles to show a zoomable map of the Southern Hemisphere (nope, there’s no street-level detail for Antarctica, but Global Biodiversity Information Facility (GBIF) have made land and sea tiles available, which can be used with attribution from https://tile.gbif-uat.org/ui/)
- cached map tiles in the browser for a smoother, faster experience using Pouch DB and https://github.com/MazeMap/Leaflet.TileLayer.PouchDBCached
- sized and centred the map on Antarctica
- added simple UI features to the Leaflet map, such as a scale
- made sure the map looks good on mobile
The GitHub repository “leaflet-antarctic-demo” at https://github.com/thomasswilliams/leaflet-antarctic-demo has the code and is served from GitHub pages at https://thomasswilliams.github.io/leaflet-antarctic-demo/.
In part 2, I’ll build on the repo and add shapefiles.
Selected references:
- http://quantarctica.tpac.org.au/quantarctica/ an amazing, comprehensive collection of open-source maps for Antarctica, with many shapefiles
- https://www.scar.org/resources/antarctic-digital-database/ SCAR’s digital database of map resources in EPSG:3031 projection
- https://www.add.scar.org/ SCAR’s Antarctic Digital Database Map Viewer, using OpenLayers and GeoServer
- http://webmap.arcticconnect.ca/#ac_3573/2/90.0/0.0 open source mapping for the Arctic (also using Leaflet) which inspired me to do something similar with Antarctic data
- https://tile.gbif-uat.org/ui/3031/ GBIF OpenLayers-based Antarctic map
- https://7sdream.github.io/antarctica/ Antarctic maps demo using Vue & Leaflet, also inspiring!
- https://leanpub.com/leaflet-tips-and-tricks Leanpub e-book on Leaflet tips tricks, an easy to read general overview of Leaflet